Blog posts are written by project team members. Topics range from conferences we attend, musings on current affairs of relevance, internal project findings and news and more succinct content which can be found in our Digital Humanities Case studies or project related publications. Blog posts will mainly be posted in English but will from time to time feature in the language of the project team member’s preference, since we are a multilingual bunch! Happy reading!
Where did it happen?: Spatial imaginaries of World War I
The Helsinki Digital Humanities Hackathon 2021 took place online from the 19th to the 28th of May. Among the seven themes for this year was "Space Wars: The location of reporting the Great War in France, Austria and Finland", which used digitised newspapers provided by NewsEye and was headed by team members of the project. In this blog post, the international newspapers group presents their findings.
Abstract: We analyzed how spatial imaginaries are manifested in the newspaper reporting on the events of WWI. To do this, we explored named entities in a dataset of 13 newspapers from France, Austria, and Finland from 1913 to 1920 provided by the NewsEye project. We developed a four-tier approach for our inquiry: 1) A named-entities-based processing of places using both clustering models and a semantic analysis through a multilingual sentence encoder. 2) A “discursive approach” using a text-analysis-tool from digital corpus linguistics (focusing on spatial co-occurrences of war-related keywords). 3) Creation of a web app for exploring NER-generated locations on a map. 4) A Wikidata-based list of battles during WWI with their geographical coordinates and their mapping.
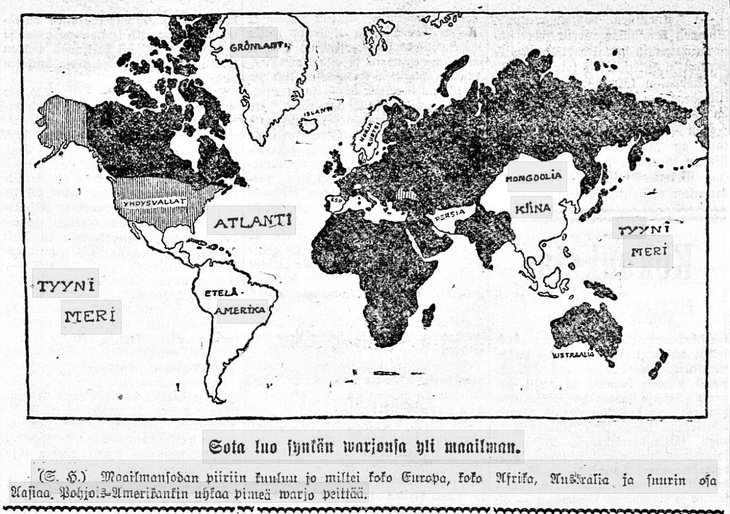
“The war casts its shadow over the world” (Helsingin Sanomat, February 14th 1917).
Introduction and Research Questions
The war years 1914–1918 created a need for intensive reporting on military operations over the world. At the time, newspapers were the primary communication channel for news events and the war itself was arguably the largest modern media event until then – for many people, its experience was created or at least shaped through newspaper pages.
It is well known that WWI was not a single war encompassing most of the world, but rather a series of conflicts and battles that were tied together by the global military, political, economic, and cultural tensions of the time. Similarly, the experience of the war, as it was presented in the media, was not coherent over time and place. Hence, the locations mentioned in the reporting varied according to the location of the newspapers, their political affiliation, and journalistic style. They produced different spatial imaginaries.
Our primary interest is how the news reporting both reflected and also created different spatial imaginaries of where and when the war happened. We believe that the locations mentioned in the newspapers can be used as proxies for the changing narratives and visions of WWI. Tracing the locations can help us understand the historical experience of the war.
Some of the central locations, such as the Western Front, have become symbolically laden and are etched in the collective memory of the war. These places of memory are crucial nodes in the current spatial imaginaries of WWI. They are recorded in public records of the war, history books, and monuments relating to the war. Our exploration of the locations in newspapers from the 1910s tries to provide an additional layer of spatial imaginaries by uncovering which locations were discussed, how they were addressed, and where they were reported on at the time.
The different censorship regimes in place during WWI affected what could be printed, and it is difficult to assess to which degree this also influenced the spatial information available in the newspapers. To be clear, our analyses might capture more the spatial imaginaries permitted to be printed by political authorities than those of the general public at the time.
Working with a sample corpus of digitized newspapers in German, French, Finnish, and English (more on the material and data below), we formulated a set of questions in relation to their spatial imaginaries and the way these can be approached through DH methods.
What were the spatial imaginaries of the ongoing war in different newspapers in the data set?
Did these imaginaries change within the period under consideration (1914–1918)?
What do we learn if we compare these spatial imaginaries by the origin of the newspaper?
Do locations (as operationalized through named entities) function as a proxy for larger narratives/visions of war?
Which modern instruments for discourse analysis, Named Entity Recognition (NER), entity linking and data visualization are suitable for those tasks?
We provide preliminary answers to these questions in the results section where we also outline them more concretely. While working with the data, we further formulated questions that relate to the comparison and visualization of the data:
How can we use external knowledge sources to make the spatial imaginaries more visible?
How can we build a web app to help historians further investigate the geospatial interrelations in the data?
Data
The data our group used in this hackathon comes from the NewsEye project (https://www.newseye.eu/). It consists of 13 European newspapers of various political affiliation, that were published in five different languages between 1913 and 1920. Of these 13 newspapers, a total of 28,885 issues are available.
We chose 6 newspapers for our analysis: two French (Le Matin and L'Œuvre), two German (Arbeiterzeitung and Neue Freie Presse), one Finnish (Helsingin Sanomat) and one English (New York Herald). The last one is actually the European edition of an American newspaper and was published in Paris.
The digitized texts available on the NewsEye platform already contained named entities - i.e. enriched lists of the place, person, and organization names mentioned in the articles which had been created through methods of Named Entity Recognition (NER). As we are interested in spatial imaginaries of the war, we focused only on location entities. For the New York Herald, we applied the NER ourselves since the texts were not tagged for named entities.
The quality of the OCR and NER varies for each individual newspaper issue and language, which creates major challenges for assessing the accuracy of the character strings recognized and classified as place names. For example, in Figure 2 we show an excerpt from Neue Freie Presse, 11.08.1914 – this is the title of the article about the start of the war between Britain and Germany. However, the NER system was able to recognize only one location in this text, namely Vienna, which is an article location rather than a location of the article event.
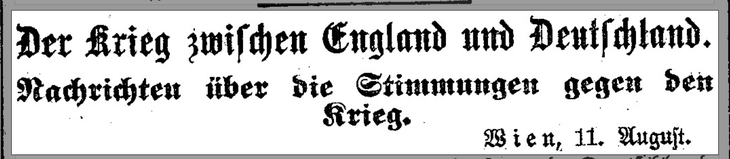
Excerpt from the Neue Freie Presse, 11.08.1914
Another source of possible errors is a geotagger that assigns geographical coordinates to named entities extracted from text. The errors stem from the noise in the data and also from the fact that many historical locations changed their names or have completely disappeared (such as the Austro-Hungarian Empire) and thus cannot be found in the modern gazetteers. To reduce noise in the Finnish part of the data, we performed an additional lemmatization step, as we noticed that the geotagger works much better on the lemmatized data.
Nevertheless, we could act under the assumption that the most important events are referred to many times in newspapers and thus could be captured even by an imperfect pipeline. In addition, we performed a manual discourse analysis on a small subset of the data, which did not rely on the NER.
Approach during the hackathon
In a team with varied background experience and expertise in history, computer science, and digital humanities, we decided to take several different approaches for tackling the research questions and exploring the spatial imaginaries of the newspapers. This also aimed for creating additional insights by comparing the results of these different approaches.
Four main avenues were taken:
A named-entities-based processing of places using both clustering models and a semantic analysis through a multilingual sentence encoder.
A “discursive approach” using a text-analysis-tool from digital corpus linguistics (focussing on spatial co-occurrences of war-related keywords).
Creation of a web app for exploring NER-generated locations on a map.
A Wikidata based list of battles during WWI with their geographical coordinates and their mapping. The information extracted from Wikidata was included as a point of comparison in the web app.
Our four avenues made it possible to approach the data as a whole, go through it manually from the perspective of the texts, explore it geospatially through the web app, and, finally, through a contemporary knowledge base.
Results
1. Georeferencing Named Entities
In order to elucidate the spatial imaginaries articulated in newspaper articles, we needed to translate textual surface forms of place mentions into a corresponding geometric entity on a map. We adopted Yao’s concept of discrete georeferencing (geocoding) as “the process of assigning locations to geographical objects within a geographic frame of reference.” (Yao, 2020)
We were relying on OpenStreetMap data provided by the Nominatim open-source georeference service.
Spatial clustering
Based on the assumption that place mentions form non-random distributions across space, we are interested in the dense agglomerations that “strike the eye” and hence indicate vital reporting activity. Although these may seem easily discernible in the first place, we believe that the most dense clusters might conceal their full depth in a conventional visualization. We thus used clustering analysis to a) gain evidence about significant densities in the data and b) provide visual support for a subsequent geospatially-informed generation of subcorpora.
Amongst numerous candidate algorithms, we fell back on Hierarchical Density-Based Spatial Clustering of Applications with Noise (HDBSCAN). The algorithm assigns each point in the dataset a density kernel of varying size. Kernel size is determined by a point’s individual distance to its k-nearest neighbour. Mutual reachability between two points is formalised in terms of the maximum of their kernel sizes and mutual distance, i.e. a target point’s concrete distance to the reference point is of no interest if it lies within the kernel of the latter. Edges with weights (mutual reachability) below a hierarchy-sensitive threshold are discarded, isolated vertices are classified as noise and the remaining standing connected components are identified as clusters. The algorithm’s main advantage consists in its capacity to detect patterns at varying scales of density. In our case, this has proved useful in identifying clusters in larger contexts where events are mostly skewed towards the newspapers’ countries of origin and quickly become sparse in the outskirts.
External Reference
Applying noise-sensitive clustering to the cartographically projected place names delivers an insightful perspective on the spatial density of places that are acute in newspaper war reports for a given period of time. Due to the uncontrolled degrees of freedom of clustering algorithm parameterisation and choice of scale, this unsupervised, domain-agnostic approach still requires a great deal of cross-checking and verification by means of stable domain knowledge in order for the observed patterns to be interpretable within the underlying historical context.
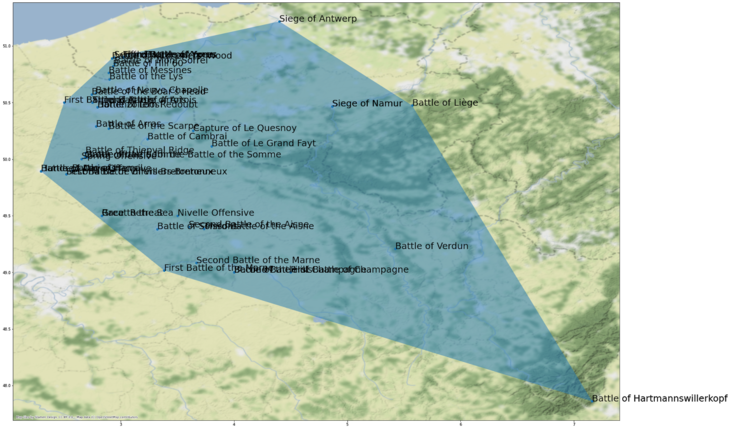
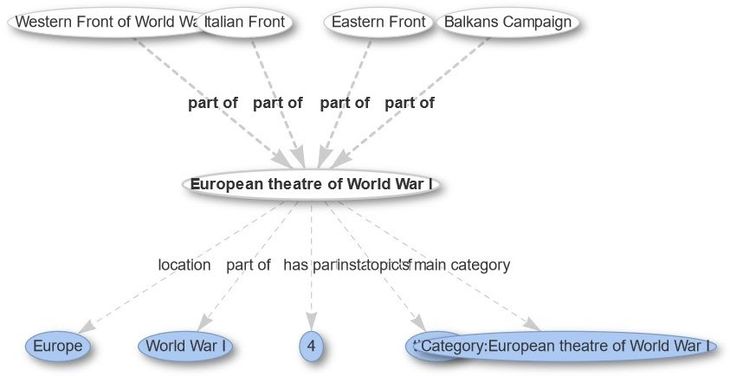
We thus turned to the Wikidata ontology of WWI which is organised in terms of the concept hierarchy depicted on the right. Focusing on the level of individual battles of a campaign enabled us to infer polygons for the respective war fronts which are not attached to the Wikidata concepts initially. For instance, we are taking the convex hull over all battles of a war campaign and use this as a filter mask for newspaper place mentions that are effectively referring to war zones.
Once we identified the place mentions within the areas of particular war campaigns, we started examining the specific textual source contexts in the newspaper data and compiling geospatially informed subcorpora.
Multilingual Sentence Encoder
Working with a cross-lingual set of newspapers, we were particularly interested in uncovering striking similarities and divergences of war reporting across languages. For that, we utilized a cross-lingual sentence embeddings model, namely Multilingual Universal Sentence Encoder (distiluse-base-multilingual-cased-v2). The model supports more than 50 languages and is oriented towards semantic text retrieval. It is trained on the OPUS open-source parallel corpus.
We extracted from the data all sentences that contain named entities associated with the Western Front. Then we applied the sentence embeddings model to produce a vector for each sentence. Consequently, the western-front-related sentences from all newspapers are mapped onto one common vector space in which similar semantic uses become explicit and measurable across languages.
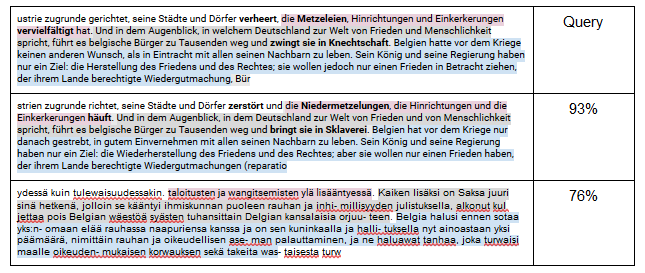
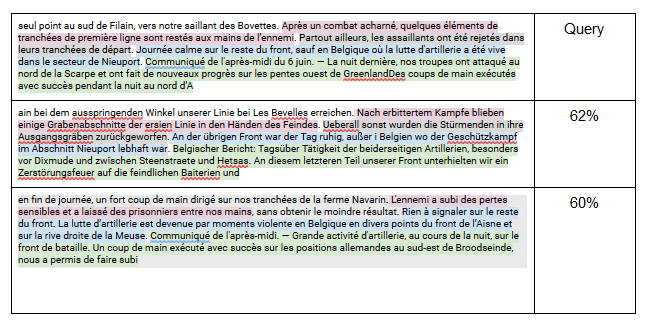
The passages above were identified by the model, and manual inspection revealed that the texts pertain to peace negotiations in January 1917. The articles are partly translations, but use different terminology and emphasize different aspects of the negotiations. Identifying such links may be very useful for historical exploration of data.
2. Spatial Imaginaries through text analysis
In a more discursive approach, we used the “textometry” software TXM – one of the numerous available software tools for statistical analysis of digital text corpora - to further explore a selected sample of the newspapers available through the NewsEye corpus. For this, we wrote a script to convert the data from the NewsEye collection to XML.
This software allows for statistical linguistic analysis, and its various tools are also useful for the analysis of historical texts. Furthermore, it is a free open-source software, compatible with the FAIR principles as it allows to create reusable corpora. We then established a list of keywords related to the First World War, and selected four from that list for their relevance in all languages:
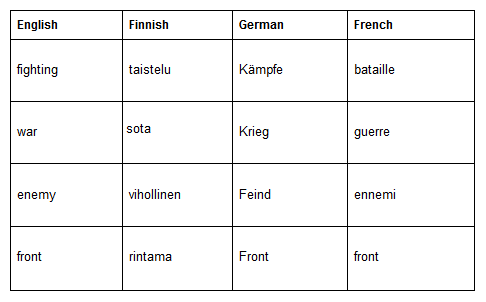
We used the co-occurrences tool on TXM to analyse these words in more detail. This tool analyses the probability of a word to appear in the same context as the selected word. We then decided to analyse the 50 spatial co-occurrents with the highest co-frequency scores for each keyword, in each newspaper in each year. For further processing this list we decided to produce a map using QGIS. Using a combination of manual and automatic methods to determine the precise geo-coordinates of each location, we were able to produce a layered map with relatively exact locations, providing us with a good overview of the spatial imaginaries in Europe at the time, in all their nuances.
From the analysis of spatial co-occurrences for war-related keywords through TXM and the resulting maps, some observations and tentative hypotheses are possible. (These should, of course, be taken with a measured degree of caution as the analysis so far only was possible based on uneven data as to newspapers, years of publication, and OCR quality.)
1.) To our surprise, the keyword “WAR” remained relatively unspecific and pale in relation to spatial references across all newspapers, languages, and years. “War” was used for considering (geo-)politics as well as more abstract dimensions of the ongoing conflict. Spatial references co-occurring with “war” are mainly whole countries (France, England, etc.), not specific locations. Meanwhile, one type of “place” visible in relation to “war” are “lieux de mémoire”, i.e. historical events which serve as points of reference for contemporary discourse, particularly earlier wars: 1870, the Napoleonic wars, the Thirty Years War, etc. are mentioned regularly in co-occurrence with “war”.
2.) The other keywords – “ENEMY”, “FIGHTING”, and “FRONT” – have yielded more concrete results in relation to spatial co-occurrences. While these still seem quite “scattered” and “volatile” for 1914, the contrary can be observed for the following years: As the war settles, it is remarkable how repetitive and stable a number of place names remain. These are often very particular indications, going down to the scale of a river’s sections or small villages. This way, the spatial references in the newspapers confirm a common assessment of World War I: the war gets “stuck” in the course of 1915 and remains spatially static at many of its fronts until its end.
Locations co-occurring with war-related keywords in Arbeiterzeitung, Helsingin Sanomat (1915 only), Le Matin and New York Herald from 1914 to 1918
3.) One of the more unexpected results was the prominence of rivers and waterways in the spatial references. This might be explained in two ways: First, spatial references in newspaper privileged geographical markers of this kind (presumably because they were easier to “pin”). Second, the prominence of rivers in newspaper coverage reflected the actual importance of these landscape elements in the military confrontation. Be it for the technological and tactical-operational conditions of the epoch or the geographical properties of the regions contested, World War I thus might be revisited, at least for the European War theatres, as a contest for rivers and as a war in Poly-Potamia. Such an approach would allow for the new interpretations through the eyes of spatial turn-inspired approaches and/or environmental history.
4.) The Austrian newspaper included in the analysis – the Arbeiterzeitung - indicates to which degree World War I was an East-European war with several war theatres in areas which today are located in Ukraine, Poland, Romania, the Balkans, Greece, Turkey, etc. This also appears, in a lesser mesure, in the French newspaper Le Matin. As to its geographical expanse and the number of actual fronts, Eastern Europe seems relatively underrated in collective memory in comparison to the iconic Western Front.
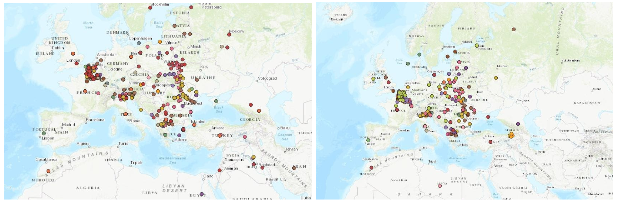
Arbeiterzeitung (1914–1918) Le Matin (1914–1918)
5.) While places and locations outside Europe are repeatedly mentioned, it is striking how little the colonial dimension of World War I seemed to figure in the newspapers analysed. The discourse analysis performed with the four keywords we identified appears to reaffirm a fundamentally Eurocentric view of the war. The further away from Europe geographically, the vaguer and grand-scaled the spatial allusions become. Also, culturally loaded and unspecific references to the “Orient” or “Turkey” are common.
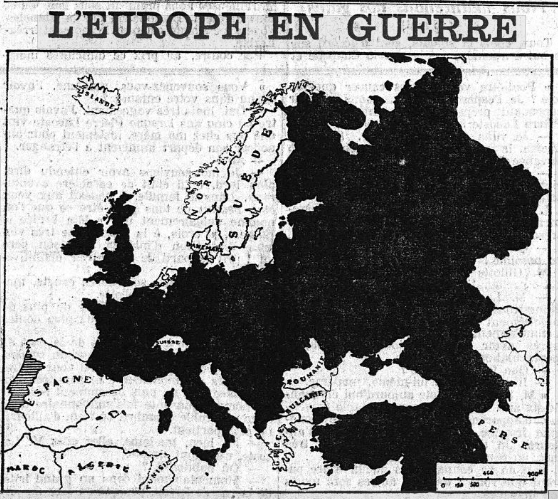
“Europe at war” (Le Matin, 25.05.1915)
3. Creating a tool for exploring locations on a map
Because of the vast amount of information they contain, newspapers collections are hard to explore through traditional web browsers. To enable further investigation of spatial named entities mentions in such collections, we developed a prototype of an interactive web app with Streamlit that combines two analyses: a visual analysis of entities located on a map and a textual analysis by showing the entities in their textual context. By exploring such datasets through map visualization and the proxy of named entities, the user can access specific articles that are linked to a particular place and explore this entity in its direct context.
The user can access this prototype at http://dhh21-webapp.newseye.eu/ and explore identified spatial named entities from Le Matin, Arbeiter Zeitung, Illustrierte Kronen Zeitung, Helsingin Sanomat, and L’Oeuvre. For computing power reasons, we had to take only a sample of our complete dataset. For the same reason, we also had to take out any entity that appears less than 3 times in the corpus. The web app is divided into three sections: the first one contains the map where the locations are displayed. The second one shows a concordancer where the entities appear in their textual context. Finally, the third section contains the different filters available for selecting data.
The map of the first section displays spatial named entities from the NewsEye dataset as blue dots. The size of the dot depends on how frequently the entity occurs in the selected sample of the dataset: the more frequent it is in the selection, the bigger the point is. The name of the place, its frequency and its coordinates will appear when the cursor hovers over the point. The user can filter the displayed locations by different properties of the newspaper articles in which they were mentioned, such as the language, publication date and newspaper title, but also by how frequently the location name occurs in the dataset.
Users can also look at a selection of battles that took place in that time period on different fronts (Western Front, Eastern Front, Balkans Campaign,…). We extracted these battles from Wikidata using SPARQL queries with the World War 1 lexeme. For each battle we extracted its name and coordinates, when it started and ended, the warfront it is associated with (western, eastern,...), in which country it took place in and its duration in days.
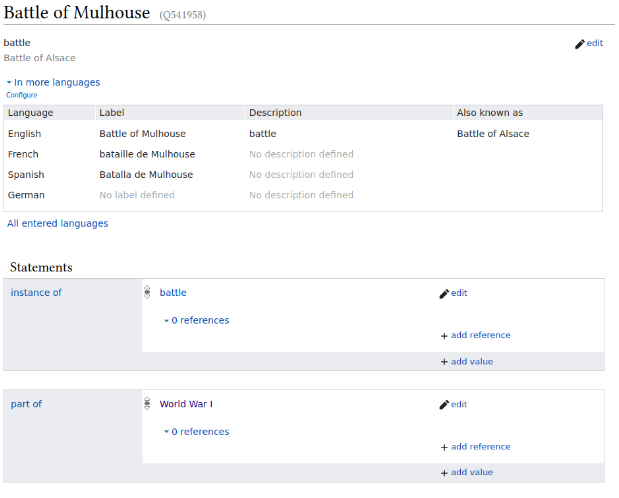
Wikidata endpoint for "Battle of Mulhouse" (7 August 1914 - 10 August 1914)
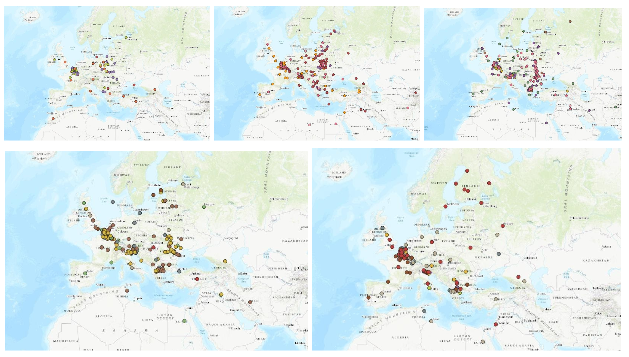
Battles appear on the map as points which range from dark to bright colours. This range of colours reflects the duration of a battle: the darker the point is, the shorter the battle lasted. The colour palette used to represent the duration of the battles appears as a colour bar on the right side of the map. As for spatial named entities, filters are available to select battles according to their duration and the front they took place in.
Finally, users can choose between six map backgrounds from free providers such as OpenStreetMap or Stamen. However, as for the geocoding step, the available maps are contemporary: as such, the countries’ names and borders represent the contemporary world and not the one from 1913–1920.
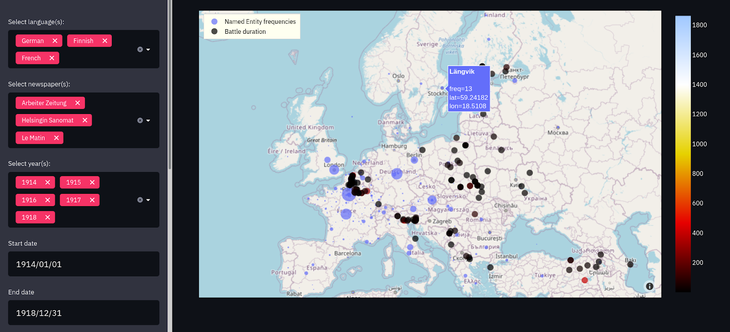
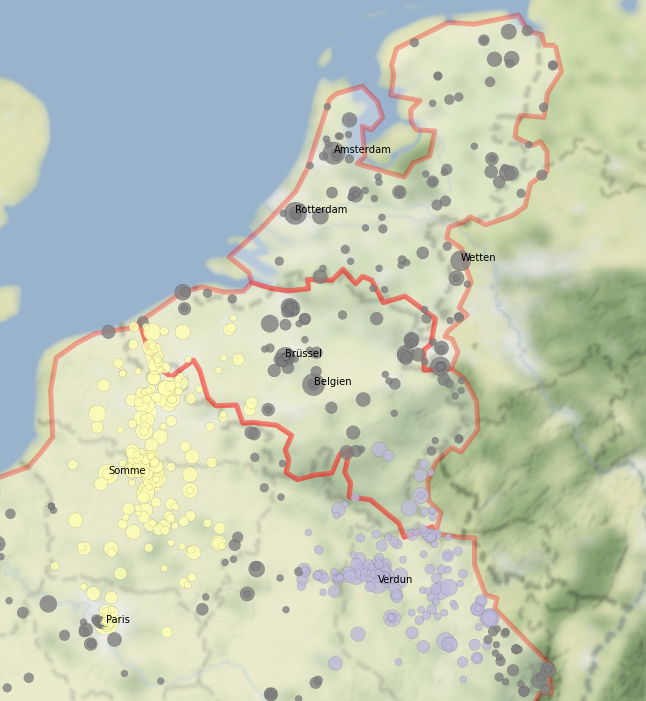
Geo-coded spatial named entities (blue points) and identified battles from Wikidata for Le Matin, Arbeiter-Zeitung and Helsingin Sanomat between 1914 and 1918
The concordancer, or context visualizer, helps the user look at every spatial named entity in its textual context. It is represented as a table where each row contains one entity mention. The concordancer shows only 50 entities at the time, but a slider located on top of it allows the user to select other entities. For each entity mention, the table shows the newspapers in which it appears, its publication date and language. It also shows the left and right side context of each entity mention. By default, this context is limited to five words before and after the mention. The user can however use a slider on top of the table to change that window, from one word up to ten. Finally, the user can access two external sources connected to the entity mention: first, they can access the newspaper article itself through the NewsEye platform by clicking on “View article”. Secondly, if the entity has been linked to a Wikidata page, the user can access that page by clicking on the link.
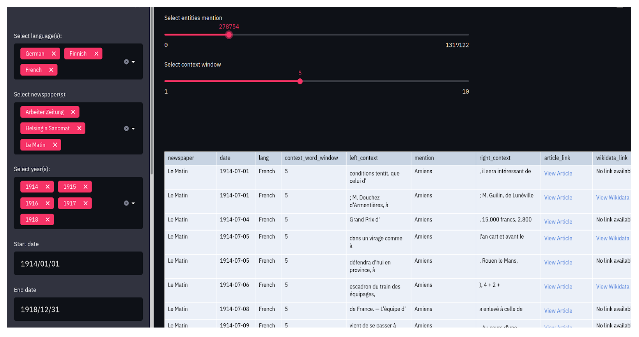
Mentions of "Amiens" (France) in Le Matin (1914-1918) in its textual context
Current challenges and future work
Scholarship in computer science often discusses named entities as a way to solve downstream problems in (digital) humanities research. Our work with the named entities in the NewsEye data provides tentative examples for such downstream tasks. We believe they can be useful in exploring censorship regimes in different parts of the world as well as inspecting more closely how the political affiliations of newspapers affect spatial imaginaries. However, to make more convincing arguments for the applicability of named entities further work is needed. For our concrete cases we see a need for:
Evaluating to which degree the varying quality of OCR skews named entity recognition and produces bias to the results.
Evaluating the reliability of named entities. For instance, we noticed that named entities seem to be more likely misidentified for Eastern European or Middle Eastern locations than for Western European ones.
Creating more extensive hand-curated lists of locations mentioned in discourses relating to the war. It would help to have manually collected mentions of locations in the more prominent sections of war reporting and to compare their results to those of more data-driven methods.
Visualizing geospatial and other ([inter]textual, socio-economical, political) interrelations on maps, i.e. relations between location and other types of entities.
Improving the geospatial analysis functionalities for the app.
Reviewing Wikidata as a knowledge base for events during WWI. In particular, it would make sense to evaluate to which degree Wikidata cements a Eurocentric view of the events with the Western Front as their epicenter.
Developing alternatives to geocoding locations with contemporary geo-references.
Exploring other methods for clustering as algorithmic assumptions predispose certain types of (anti-)patterns. For instance, DBSCAN distinguishes non-random agglomerations in dense contexts, but fails to capture patterns at varying density scales.
Linking semantically similar war reports back to mentioned places and examine differences in reporting.